
Context
Customers discuss brands and service experiences throughout the day. Reading every post manually is monotonous, slow, and error-prone, while delayed analysis can allow reputation or service issues to escalate.
Solution
A natural language processing pipeline collects public feedback at intervals, classifies positive, neutral, and negative sentiment, groups issue descriptions into categories, and publishes comparative trends and dashboards.
Potential benefits
Benefits are working hypotheses to validate against the target data, workflow and operating environment.
- Surfaces customer concerns and appreciation
- Measures campaign and brand perception
- Detects emerging incidents earlier
- Supports evidence-based customer-care planning
Where SocialPulse Can Be Used
- Brand Monitoring
- Campaign Measurement
- Customer Experience Analysis
- Product Feedback
- Reputation Management
- Emerging Issue Detection
- Competitor Benchmarking
- Service-quality Monitoring
Product workflow
Prototype screens use demonstration data and illustrate the workflow rather than a production deployment. Interfaces and outputs are configured for each organization.
Third-party names and interfaces, where visible, identify demonstration context only. Their marks belong to their respective owners and do not imply endorsement or partnership.
Indian Quick-Service Restaurant Public Sentiment Analysis
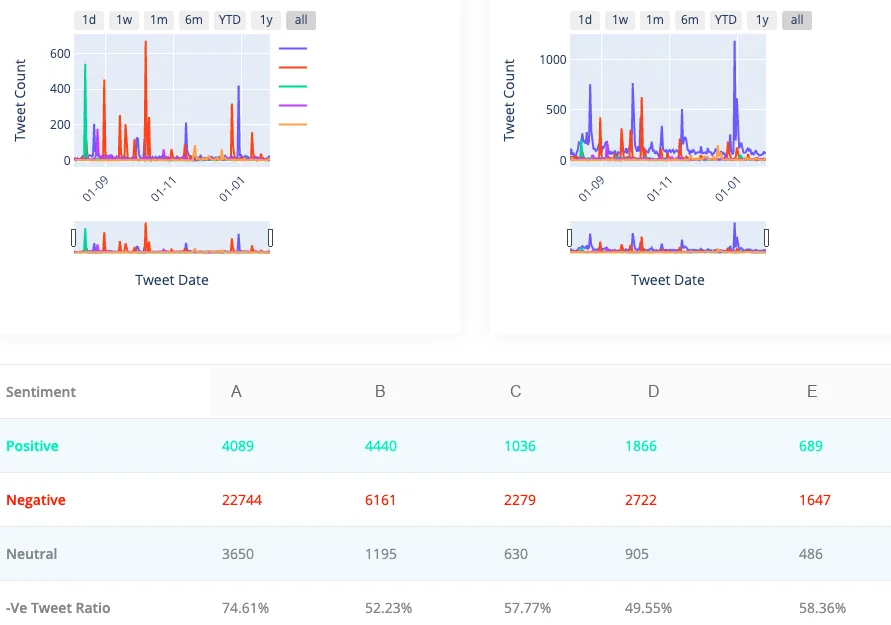
Measure sentiment volume and direction
Positive and negative Tweet trends reveal changes in public conversation over time, while sentiment counts and negative-feedback ratios provide a consistent basis for comparing five Indian quick-service restaurant brands.
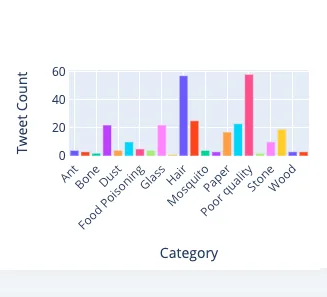
Understand what is driving concern
Quality-related Tweets are grouped into issue categories such as foreign objects, packaging, poor quality and other product concerns. Comparing category distributions helps identify the dominant operational themes for each brand.
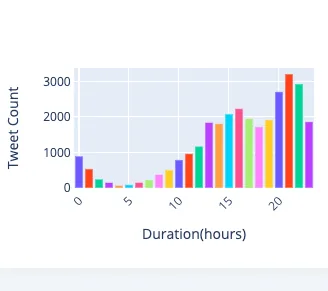
Plan for peak conversation periods
Hourly patterns show that public feedback rises during evening and dinner periods. Customer-care capacity can be aligned with these peaks to improve response time and service recovery.
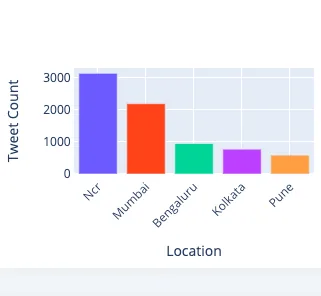
Locate concentrations of feedback
City-level analysis highlights the markets producing the greatest volume of customer discussion. Teams can use this view to prioritize local investigation and region-specific improvements.
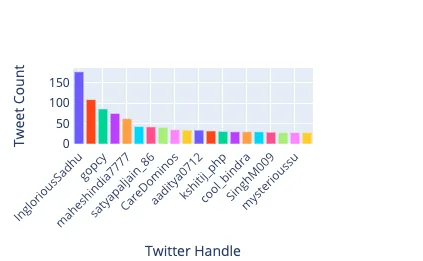
Recognize repeated customer engagement
The distribution of Tweets by user identifies accounts posting repeatedly about an issue. This can help customer-care teams recognize unresolved conversations and prioritize follow-up.
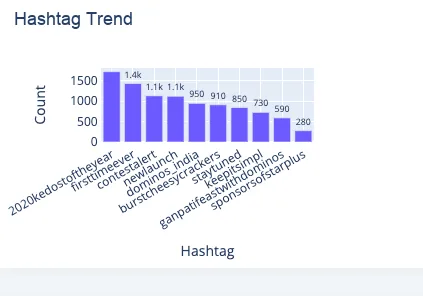
Track topics gaining attention
Hashtag volumes show whether discussion is concentrated around a few dominant themes or distributed across a longer tail. This reveals the campaigns, events and topics attracting the greatest public attention.
How this implementation works
- The application extracts text from social media sources—currently X (formerly Twitter)—at regular intervals.
- It classifies each post as positive, negative or neutral to reveal the underlying customer sentiment.
- Issue descriptions are categorized into recurring themes so teams can identify the subjects driving customer feedback.
- Interactive dashboards convert the analyzed data into meaningful trends, comparisons and operational insights.
- Brands can be compared using the volume, sentiment and themes found in publicly available social-media feedback.
Responsible deployment
Production use requires fit-for-purpose evaluation, privacy and security controls, clear human accountability, monitored performance, and a fallback for uncertain or harmful outputs.
- Collect only lawfully accessible data in line with platform terms, applicable law and documented purpose.
- Minimize personal identifiers, use aggregation where possible, and define a short retention period for raw posts.
- Treat sentiment and user-activity signals as imperfect indicators; require contextual human review before action.