
Context
Fixed reports expose only predefined views, complex analysis can be difficult to add, and inaccurate forecasts weaken planning across marketing, operations, inventory, and supply chain.
Solution
A web platform combines configurable sales dashboards with weekly-to-yearly forecasting, market-basket analysis, and a conversational assistant that answers sales questions and generates charts on demand.
Potential benefits
Benefits are working hypotheses to validate against the target data, workflow and operating environment.
- Creates one view across reporting and analysis
- Improves planning with forward-looking estimates
- Supports complex custom analytics
- Provides self-service access to sales questions
Where SalesPulse Can Be Used
- Demand Planning
- Inventory Planning
- Revenue Forecasting
- Sales Performance Management
- Promotion Analysis
- Territory Planning
- Supply-chain Planning
- Executive Reporting
Product workflow
Prototype screens use demonstration data and illustrate the workflow rather than a production deployment. Interfaces and outputs are configured for each organization.
Third-party names and interfaces, where visible, identify demonstration context only. Their marks belong to their respective owners and do not imply endorsement or partnership.
Sales Intelligence and Forecasting Analysis
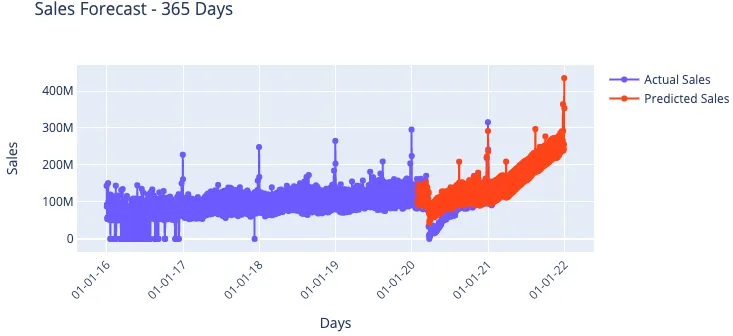
Anticipate long-term demand
A 365-day forecast extends historical sales into a forward-looking demand curve, helping leadership assess trajectory, seasonality and capacity needs over a longer planning horizon.
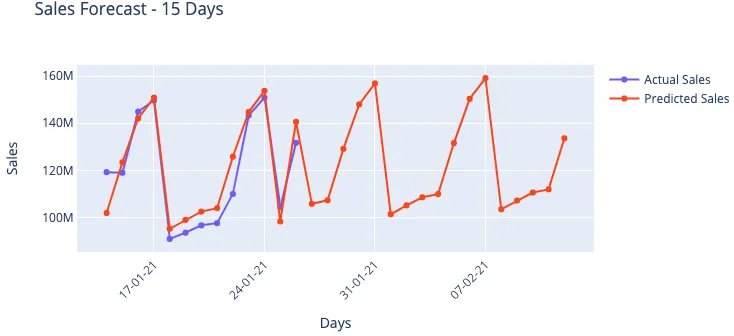
Plan near-term operations
A focused 15-day view makes short-term fluctuations easier to interpret and supports immediate inventory, staffing, delivery and promotional decisions.
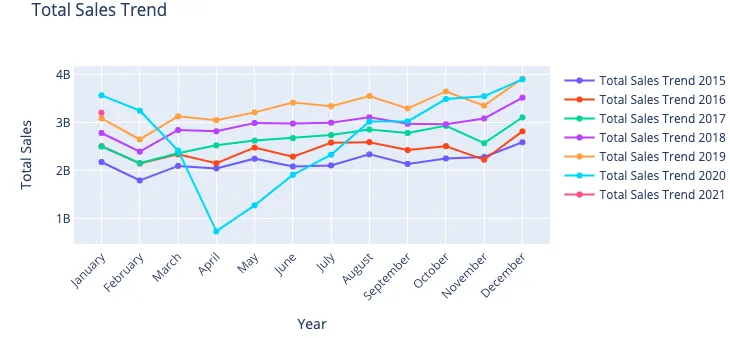
Uncover recurring sales patterns
Comparing monthly performance across years exposes seasonality, growth patterns and unusual changes that may need deeper investigation.
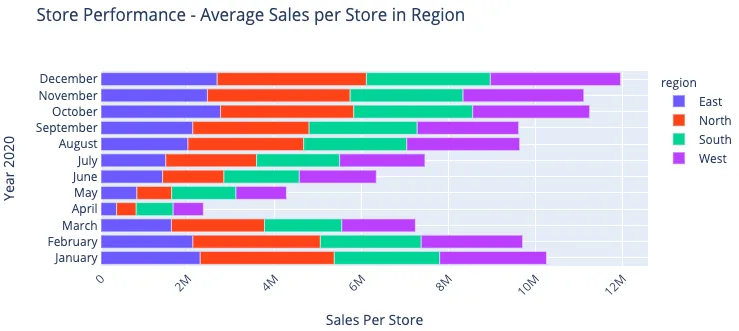
Compare performance across regions
Regional contribution views reveal where average store sales are strongest and how performance changes over time, enabling more focused commercial planning.
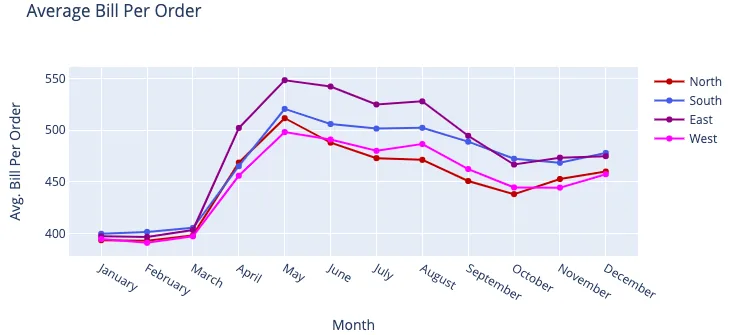
Monitor customer spending behavior
Average bill trends show how order value differs by region and month, providing a useful signal for pricing, product mix, promotions and customer behavior analysis.
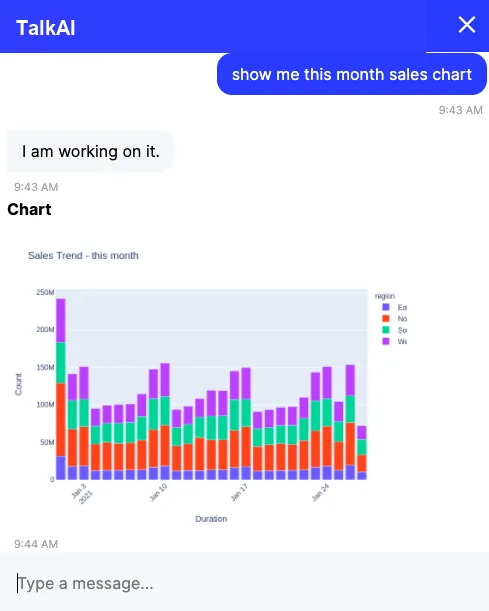
Ask business questions naturally
TalkAI converts a natural-language request into a relevant sales chart, allowing business users to explore data and retrieve answers without manually navigating reports.
How this implementation works
- A modern web-based analytics platform provides interactive dashboards for sales, orders, revenue, delivery, customer behavior and other business metrics.
- Flexible reporting and visualization capabilities support complex, customized analysis without being constrained to predefined reports.
- Short-, medium- and long-term forecasting identifies trends, anticipates demand and supports data-driven business planning.
- Advanced analytics and machine learning enable trend analysis, customer insights, product affinity, market-basket analysis and predictive analytics.
- TalkAI, an AI-powered conversational assistant integrated into the platform, allows users to ask questions about business data in natural language and receive answers, summaries, insights and charts without navigating multiple dashboards.
- The platform transforms raw business data into actionable insights, predictions and recommendations to support faster, better-informed decisions.
Responsible deployment
Production use requires fit-for-purpose evaluation, privacy and security controls, clear human accountability, monitored performance, and a fallback for uncertain or harmful outputs.
- Validate output quality against representative data and agreed acceptance measures before production use.
- Keep an accountable person in control of consequential decisions and exception handling.
- Limit access, collection and retention to the documented business purpose.