
Context
Sales and operational data is often available in spreadsheets or transactional exports, but answering a new business question can still require an analyst to define metrics, aggregate records, build charts, interpret patterns and prepare a report. Static dashboards cover recurring measures but may not answer an unplanned product, regional or profitability question without additional work, creating delays between a business question and a useful decision.
Solution
Accepts a business dataset directly in the conversation alongside a natural-language analytical request.
Calculates sales, order, regional, product, customer, shipping and profitability measures without requiring the user to write formulas, queries or code.
Presents structured tables with plain-language inferences that explain trends, relative performance and notable exceptions.
Connects weaker performance areas with proposed actions such as targeted campaigns, customer engagement and seasonal promotions.
Generates interactive visualizations for time, geography, segments, products, shipping and profit, with controls and hover-level detail.
Retains the dataset and conversational context when the user asks to review the same evidence from a product perspective.
Reframes the analysis around profitability to identify high-profit products, loss-making items, stronger categories and valuable segments.
Keeps important metrics and recommendations subject to validation against approved source data and responsible business-owner review.
Potential benefits
Benefits are working hypotheses to validate against the target data, workflow and operating environment.
- Shortens the path from business data to usable insight
- Reduces repetitive ad hoc reporting and chart creation
- Makes analysis accessible through plain-language questions
- Combines calculations, visuals, interpretation and recommendations
- Supports flexible regional, product and profit follow-up analysis
- Keeps the question, evidence and conclusions in one workspace
- Helps analysts focus on governance and deeper investigation
- Preserves human review for commercial and financial decisions
Where InsightLens Can Be Used
- Sales Performance Analysis
- Regional and Geographic Analysis
- Product and Category Performance
- Profitability and Margin Analysis
- Order and Shipping Analysis
- Customer-segment Analysis
- Trend and Seasonality Review
- Executive Reporting
- Marketing Decision Support
- Inventory and Portfolio Review
- Ad hoc Business Questions
- Interactive Data Exploration
Product workflow
Prototype screens use demonstration data and illustrate the workflow rather than a production deployment. Interfaces and outputs are configured for each organization.
Third-party names and interfaces, where visible, identify demonstration context only. Their marks belong to their respective owners and do not imply endorsement or partnership.
Conversational Sales Analytics Journey
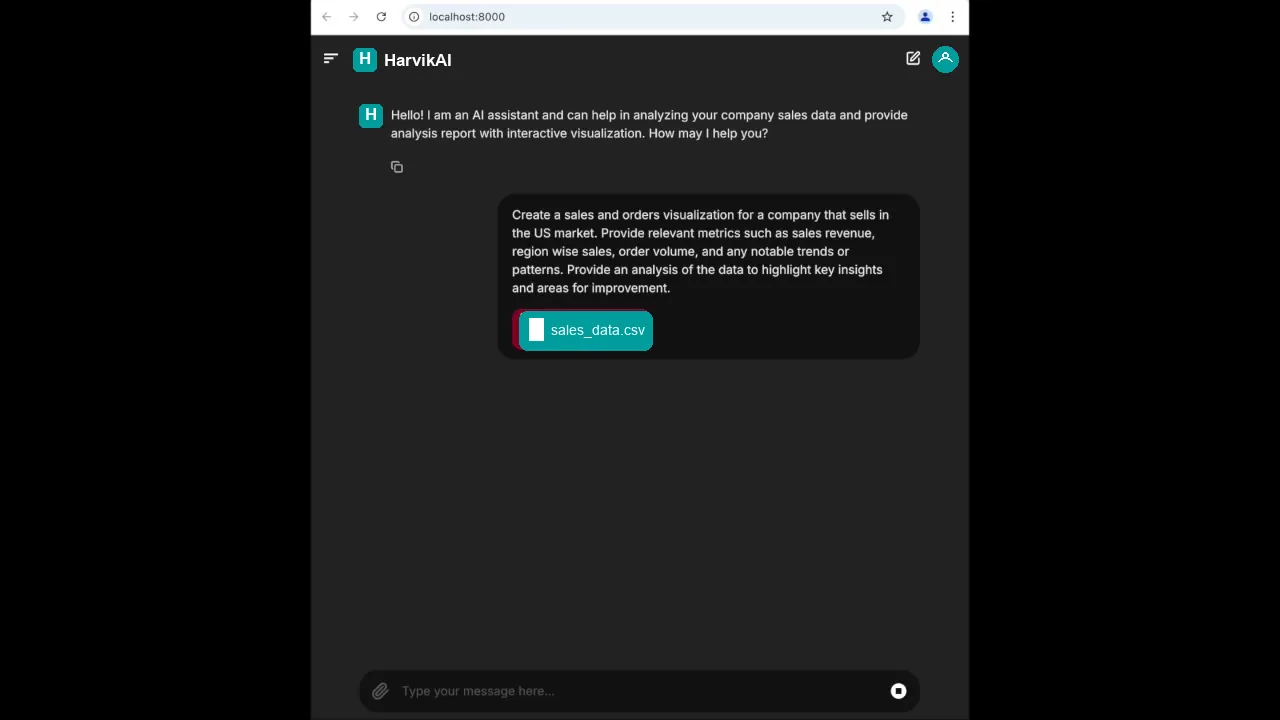
1. Attach data and ask the business question
The user combines a transactional sales file with a request for revenue, regional performance, order volume, trends and improvement opportunities. The assistant receives both the evidence and the desired outcome in one conversational step.
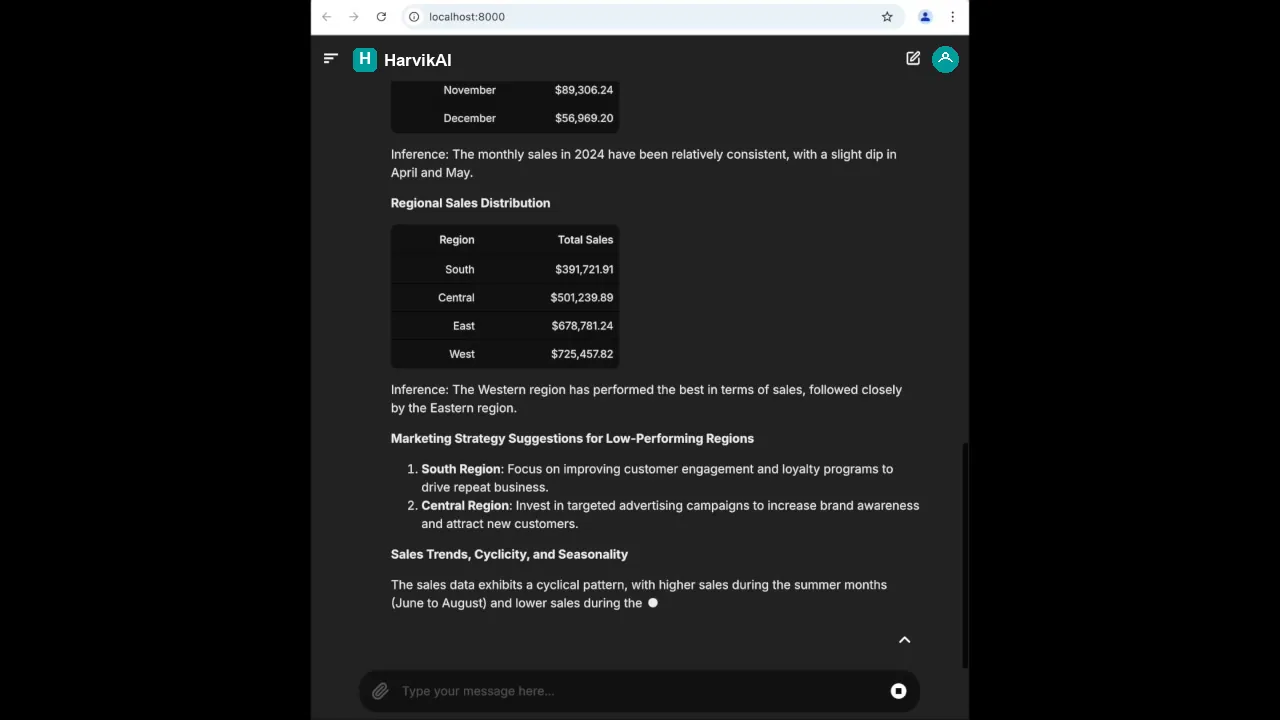
2. Interpret performance, not just totals
Calculated regional results are paired with plain-language inferences and suggestions for lower-performing areas. This turns a table of numbers into hypotheses and possible actions that a responsible business owner can investigate.
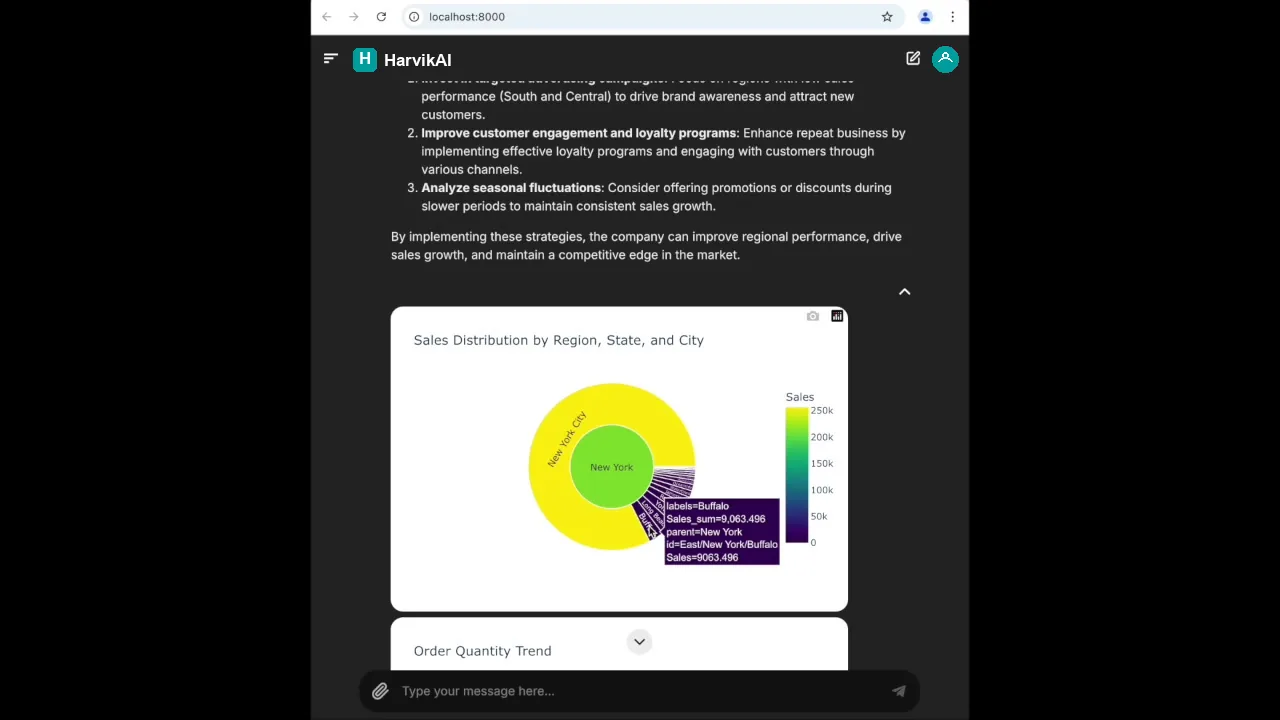
3. Explore the visual evidence
The hierarchy chart lets users move from regional totals into state and city detail. Visible controls and hover information make the visualization an exploratory analytical surface rather than a static report image.
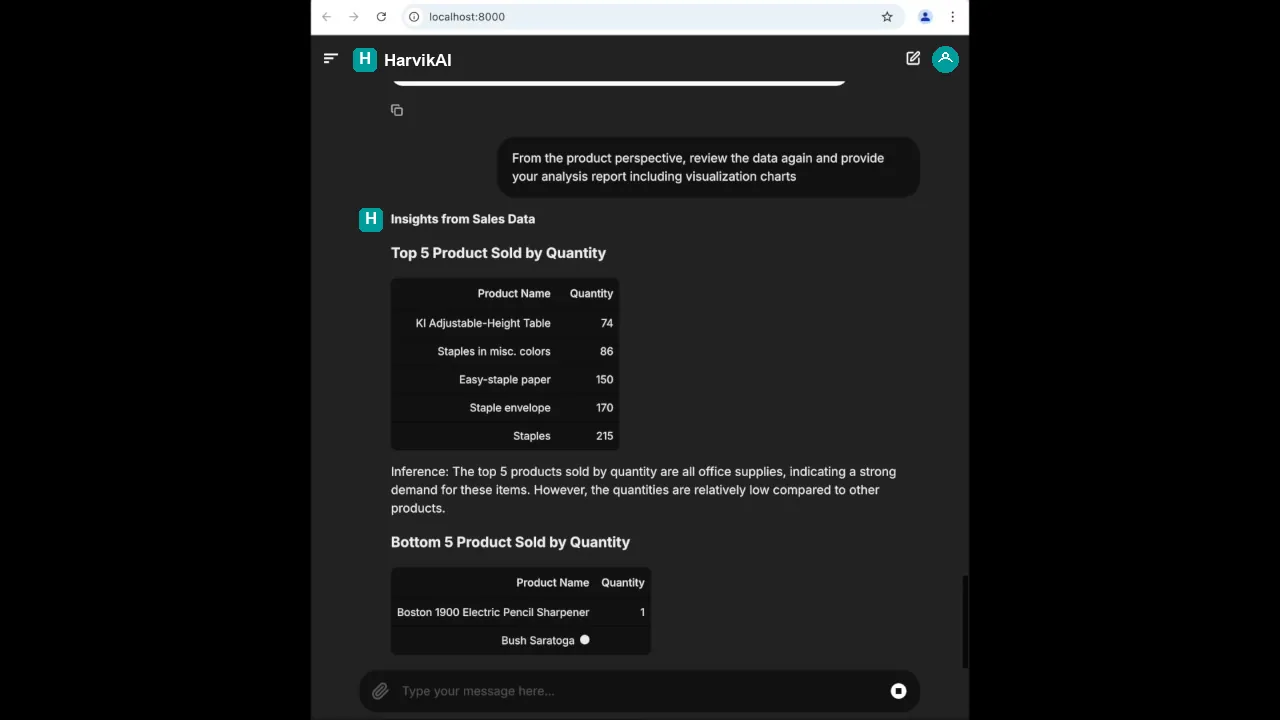
4. Reframe the same data conversationally
Without re-uploading the file, the user asks for a product perspective. The assistant retains context and produces ranked product tables, interpretations and supporting charts for a new business lens.
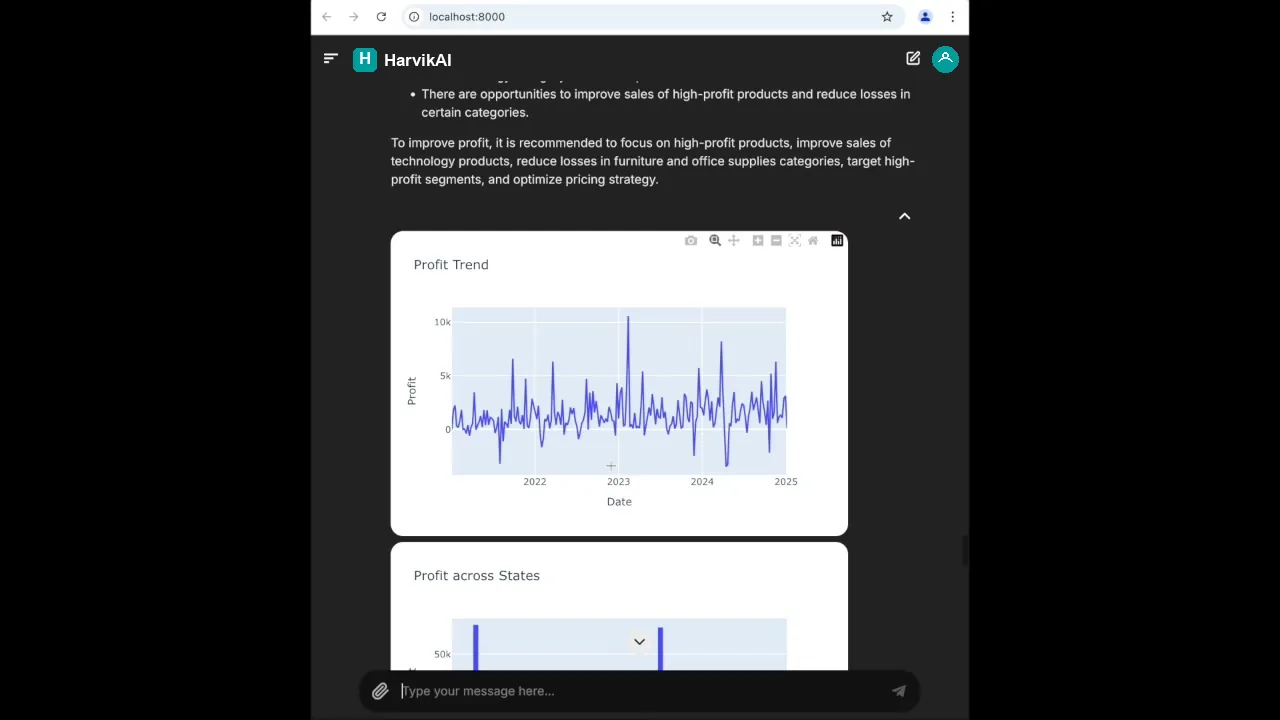
5. Connect profit findings with decisions
The profit-focused response highlights patterns across time and states and proposes actions around high-profit products, weaker categories, valuable segments and pricing. These recommendations support investigation rather than replacing financial review.
How this implementation works
- The user attaches an approved sales dataset and describes the required measures, trends, insights and improvement opportunities in ordinary business language.
- The assistant calculates monthly and regional performance and presents the figures in structured tables with concise interpretations.
- Lower-performing regions are connected with possible marketing, engagement and seasonal actions for business-owner consideration.
- Interactive charts let the user inspect the same data across region, state and city and view underlying values through chart controls and hover details.
- The user can ask a product-focused follow-up without uploading the dataset again or restating the original analytical context.
- Product-level tables compare stronger and weaker items by quantity and are accompanied by explanations and additional visual analysis.
- A further profit-focused question reframes the same dataset around profitable products, loss-making items, categories, segments and pricing considerations.
- The assistant proposes actions, but material sales, pricing, inventory and financial decisions remain subject to metric validation and human approval.
Responsible deployment
Production use requires fit-for-purpose evaluation, privacy and security controls, clear human accountability, monitored performance, and a fallback for uncertain or harmful outputs.
- Validate output quality against representative data and agreed acceptance measures before production use.
- Keep an accountable person in control of consequential decisions and exception handling.
- Limit access, collection and retention to the documented business purpose.